


Markup is the percentage you add to your costs. Margin is the percentage of revenue you keep as profit. They are not the same number: a 25% markup only produces a 20% margin. Most contractors who target a 20% profit margin but apply a 20% markup are losing 3.3% on every job without realizing it.
Key Takeaways
-
Markup vs. Margin: Markup is what you add to your costs; Margin is what you keep after the job is done.
-
A 20% markup only results in a 16.7% gross profit margin.
-
Specialty trades should target a 6.9% to 8.5% net profit margin (after overhead) [1].
-
To achieve a healthy baseline, target 10% for overhead and 10% for profit [1].
-
It currently takes construction companies an average of three months to collect payment on invoices [3].
What is Markup?
Markup is the percentage you apply to your costs to ensure you aren’t just breaking even. It answers the question: “What percentage am I adding to my costs to set my bid?”
The Formula:
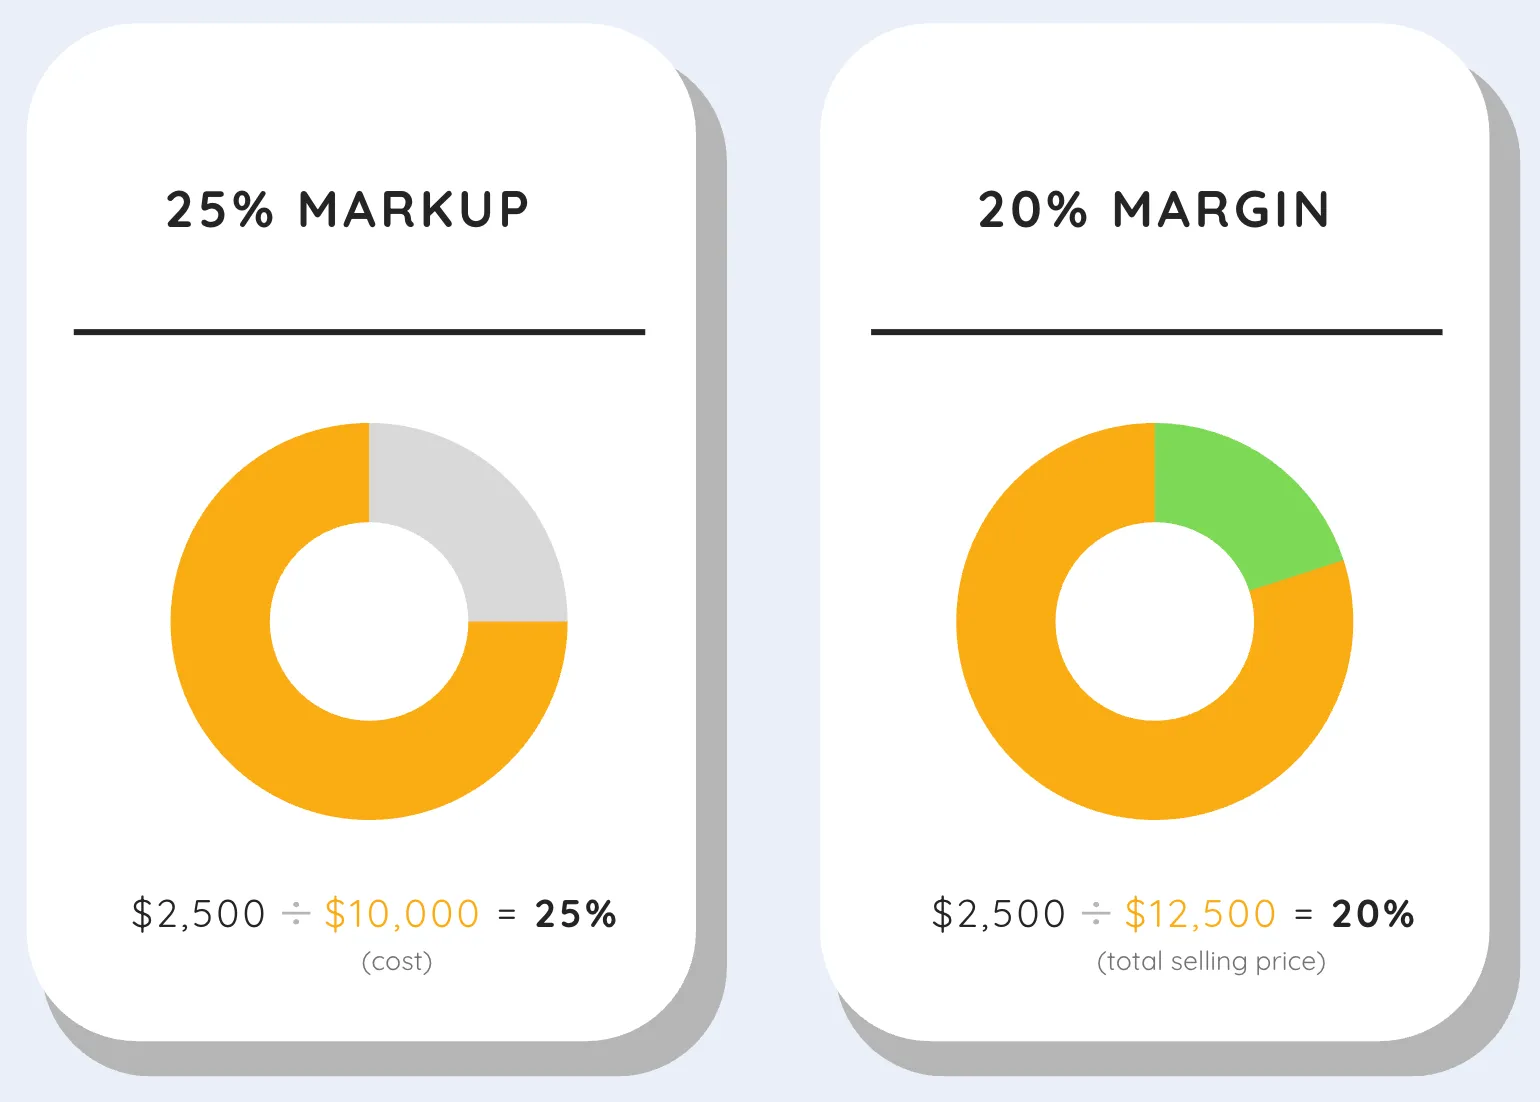
The Example: You are bidding on a commercial lighting upgrade. After wire, materials, and burdened labor, your total direct cost is $10,000. To remain competitive while covering overhead, you apply a 25% markup.
-
Markup Calculation: 25% of $10,000 = $2,500
-
Selling Price: $10,000 (cost) + $2,500 (markup) = $12,500 Total bid
What Is Margin (aka Gross Profit Margin)?
Think of margin as your breathing room. It answers the question: “Of every dollar the customer pays me, how many cents do I actually keep?”
The Formula:
The Reality Check: Let’s look at that same $12,500 bid. Your profit is $2,500.
-
Margin Calculation: $2,500 / $12,500 = 20% Margin
-
The Result: Even though you “marked up” the job by 25%, your margin is only 20%. You kept 20 cents of every dollar.
Check your own numbers. Plug your job cost into the calculator below to see the gap between your markup and your actual margin.
Why Markup Doesn’t Equal Margin
The math trip-up happens because you’re comparing the same $2,500 profit to two different numbers. Since your selling price is always higher than your cost, that $2,500 will always look like a smaller percentage when you calculate it as margin.
| If you want this Margin… | You must use this Markup… |
|---|---|
| 10% | 11.1% |
| 15% | 17.6% |
| 20% | 25.0% |
| 25% | 33.3% |
| 30% | 42.9% |
The ECmag report finds that 38% of all plans received by contractors are incomplete [4]. If you are operating on that 20% margin from the example above, a single miscalculation or a week-long delay due to incorrect specs can start to eat into those margins.
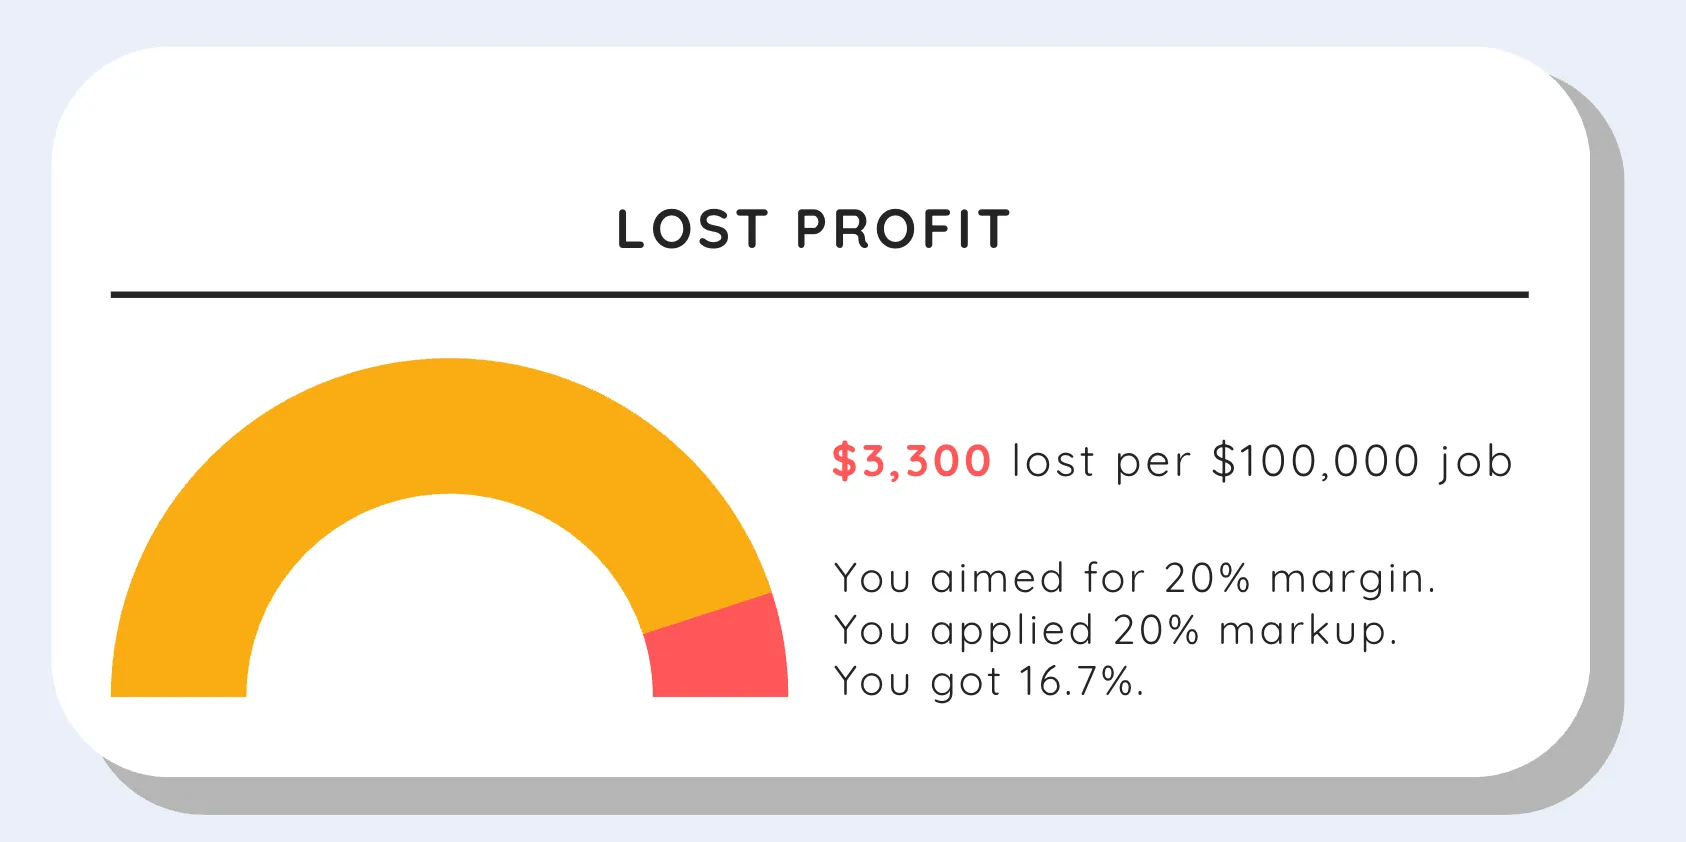
If you need a 20% margin to cover your overhead, but you only apply a 20% markup to your materials, you are losing 3.3% of your profit on every single job. On a $100,000 project, that’s $3,300 gone just because of a calculator error.
Why material price volatility makes these numbers critical
The market is shifting fast. Construction input prices rose at a 6% annualized rate in early 2025, and they aren’t slowing down [3]. Essential materials like copper wire, cable, and switchgear have seen some of the highest and most volatile price hikes in recent years [3].
Three Major Risks to Your 2026 Profitability:
-
Material Price Volatility: If you are bidding jobs using material prices from even six months ago, you are underbidding. These outdated costs eat into your margins before the project even starts. Keeping a centralized price catalog updated from actual vendor invoices is the simplest way to close this gap.
-
The “20/20” Math Trap: This is the most expensive mistake a contractor can make. Aiming for a 20% profit margin but accidentally applying a 20% markup results in a 16.7% margin. In real dollars, that means you walk away with 16% less cash than you originally intended.
- The “Wait Time” Tax: With average collections now stretching past 90 days, your cash is often locked up while your bills are due. To stay afloat, many contractors are now increasing their bids by up to 10% just to cover the cost of waiting to get paid [3].
Contractors who track actual costs against estimates in real-time achieve 15-25% higher margins than those who wait until the project is over to check the numbers [1]. VoltPro shows you your exact margin and profit as you build the estimate, so you know whether the numbers work before you hit send.
Your margin target is only as good as your cost input
You can nail the markup-vs-margin math perfectly and still end up short. The reason is usually the same: the labor cost going into the formula is too low.
Most electrical contractors price labor off a number of hours that looks right but doesn’t reflect how their business actually runs. When the cost input is wrong, the margin output is wrong. That holds no matter how correctly you applied the formula.
The paid hours you don’t bill
Start with 2,080. That’s a full-time year on paper: 40 hours times 52 weeks. A lot of contractors use that number, consciously or not, when they think about what they can bill or what overhead rate to set.
BLS Employer Costs for Employee Compensation data (Q4 2025) confirms that paid leave represents 5.1% of total compensation for construction workers [5]. That’s roughly 136 to 200 hours per year in vacation, holidays, and sick time. These are hours you pay for that never go on a job.
EC&M Magazine, citing the NECA Manual of Labor Units directly, reports that actual installation work accounts for only 68% of a NECA labor unit [6]. The other 32% is job layout, plan study, material handling, mobilization, cleanup, and breaks. These are real, necessary field activities. But they are not installation hours, and the NECA MLU builds that reality into every labor unit value it publishes.
FMI’s 2023 Labor Productivity Study found that 60% of contractors believe 11% or more of their field labor cost is outright wasted [7], on top of the normal non-billable time from PTO, training, and mobilization.
Add drive time between jobs, supply house runs, safety meetings, callbacks on past work, and time spent estimating jobs you don’t win. For a contractor running multiple small commercial jobs, that’s another 100 to 250 hours a year. For a project contractor on a single site for months, it’s less. But it’s not zero.
What a realistic year looks like
| Hours component | Low estimate | High estimate | Basis |
|---|---|---|---|
| Paid hours (base) | 2,080 | 2,080 | 40 hrs x 52 weeks |
| Less: PTO and holidays | (136) | (200) | BLS ECEC Q4 2025 |
| Less: training, safety meetings | (40) | (80) | Practitioner consensus |
| Less: drive time, supply runs, callbacks | (50) | (250) | Varies by shop type |
| Less: quoting, admin, shop time | (100) | (200) | Practitioner consensus |
| Estimated billable project hours | ~1,350 | ~1,650 |
The midpoint is roughly 1,450 to 1,500 hours. Service-heavy shops running multiple small jobs with daily driving land toward the low end. Single-site commercial project contractors land toward the high end.
Price off 2,080 hours and you leave over $1,500 on the table
Say your annual overhead is $60,000. Divide by 2,080 hours and you get $28.85/hr to recover overhead on every billable hour. Divide by 1,500 and it’s $40.00/hr. That $11.15 difference multiplied across 140 hours on a mid-size commercial job is $1,561 in unrecovered overhead. Gone before you pick up a tool.
Now you know your markup-vs-margin formula is right. But the number you put into the cost side was built on a false assumption. The output was always going to come up short.
Run your overhead rate and labor cost calculations off your actual billable hours, not the theoretical maximum. Adjust once a year when your overhead costs are fresh. The free electrical job pricing calculator includes a billable hours input for exactly this reason. Set your real number and the bid price follows.
Conclusion
Understanding the difference between markup and margin is the difference between owning a job and owning a business. Markup gets you the bid. Margin ensures your business keeps growing.
The math doesn’t change, but the market does. If you are still calculating markup by hand or in a spreadsheet, use the free markup and margin calculator to check your numbers on any job, or download the free electrical estimate template to get the formulas into a spreadsheet. When you are ready for automatic margin tracking and branded proposals, VoltPro picks up where the spreadsheet leaves off. If you are not sure whether you need estimating software, proposal software, or both, here is how to think about the difference.
Resources
-
[1] Daniela Pedroza, “General Contractor Profit Margin: 2025 Data Report”, Siana Marketing (Updated Oct 2025).
-
[2] HVAC Industry Standards: ShareWillow, “HVAC Profit Margins” and Therapeutic Tax, “Understanding HVAC Profit Margins”.
-
[3] Commerce Bank, “U.S. Construction Industry Report: An inside look at how companies are adapting to the current market” (August 2025).
-
[4] Ross, C. (2024). “2024 Profile of the Electrical Contractor” and “2024 Profile of the Electrical Contractor: Part 2” Electrical Contractor Magazine.
-
[5] U.S. Bureau of Labor Statistics, “Employer Costs for Employee Compensation” (Q4 2025).
-
[6] EC&M Magazine, “The Secret to Estimating Labor More Effectively” (2009), citing the NECA Manual of Labor Units.
-
[7] FMI, “Construction Labor Productivity: The $20 Billion Opportunity” (2023 Labor Productivity Study).